SIS Application of Quantitative Data Analytics to Sensory Testing

Imagine spending $8 million on product development only to watch it die in market because consumers “didn’t like how it felt.” No explanation. No second chances. Just painful quarterly results and uncomfortable board meetings.
This nightmare scenario plays out every day across industries. Products that ace every lab test but crash spectacularly when actual humans experience them… Why? Because that mountain of sensory data you collected is utterly worthless unless you can extract the signal from the noise.
You don’t need more data. You need better analytics.
Table of Contents
✅ Listen to this PODCAST EPISODE here:
How Quantitative Analytics Transforms Your Sensory Testing Data
Your standard sensory testing probably tells you that consumers preferred Product A over Product B. Great. But that’s where most analysis stops—right before the actually useful insights begin.
The SIS application of quantitative data analytics to sensory testing takes you dramatically further by answering questions that actually drive product decisions:
- Which specific combination of 3-4 sensory attributes explains 80% of preference variation across different consumer segments? (Not the 20+ attributes you’ve been tracking)
- At exactly what point during the usage experience do key sensory perceptions shift from positive to negative? (Hint: it’s rarely where you think)
- Which sensory attributes have narrow “acceptance windows” where small deviations tank preference scores? (These are your formulation danger zones)
- What hidden sensory patterns exist in your category that no competitor has discovered yet? (This is where category disruption happens)
Key Quantitative Techniques That Actually Unlock Sensory Insights

Forget basic averages and top-box scores. The power of the SIS application of quantitative data analytics to sensory testing comes from specialized techniques specifically designed for the complexity of sensory data:
Multivariate Analysis: Seeing the Forest (and the Trees)
Your consumers don’t experience product attributes in isolation, so why analyze them that way?
Techniques like Principal Component Analysis (PCA) and Partial Least Squares Regression (PLS) let you:
- Identify which combinations of sensory attributes actually drive preference (often revealing relationships you never suspected)
- Map products in multidimensional sensory space to spot white space opportunities competitors haven’t noticed
- Understand how your products truly compare to competitors on dimensions that actually matter, not just the ones you’ve been fixating on
For example, a skincare company was stunned when the SIS application of quantitative data analytics to sensory testing revealed that 83% of preference variation in their category was explained by just three previously ignored sensory dimensions—none of which appeared in their product specs or marketing.
Cluster Analysis: Because Your Consumers Aren’t All the Same Person
The “average consumer” is a dangerous myth. Advanced segmentation through the SIS application of quantitative data analytics to sensory testing reveals:
- Distinct consumer tribes with dramatically different sensory preferences that get lost in aggregate data
- Exactly which sensory profiles will drive passionate loyalty in specific high-value segments
- Whether your category rewards sensory specialization or broadly appealing profiles
Actually, by developing products specifically optimized for the most underserved segment, you can create a cult-like following among consumers who have been settling for “acceptable” products for years.
Temporal Methods: Because Sensory Perception Isn’t Static
That single-point-in-time rating you’re collecting? It’s missing the entire story of how your product is actually experienced. The SIS application of quantitative data analytics to sensory testing employs sophisticated temporal techniques to:
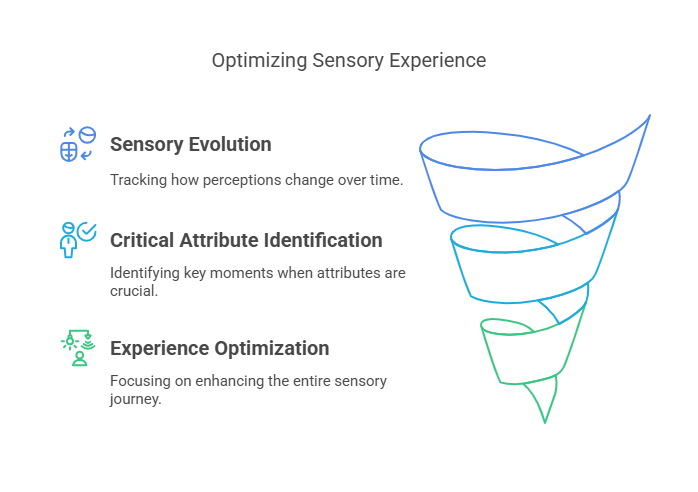
- Track how sensory perceptions evolve from first impression through lingering aftertaste or after-feel
- Identify exactly when during usage experience specific attributes become make-or-break
- Optimize the complete sensory journey instead of just initial impact
Penalty Analysis: Finding the Sensory Danger Zones
Not all sensory attributes have a linear relationship with preference. Some have a “sweet spot” with steep penalties for missing it in either direction. The SIS application of quantitative data analytics to sensory testing uses techniques like:
- Just-About-Right (JAR) scaling to identify the precise ideal intensity for each attribute
- Penalty analysis to quantify exactly how much preference drops when attributes miss their target
- Optimization models that balance multiple attributes at their ideal intensities simultaneously
From Data to Decisions: How These Analytics Actually Transform Your Business

Stop collecting data that gathers dust. The SIS application of quantitative data analytics to sensory testing transforms complex analyses into decisions you can actually execute on:
Product Optimization That Actually Works
When your products need improvement, stop guessing what to change:
- Identify the specific 2-3 sensory attributes most responsible for consumer disappointment
- Quantify the potential preference impact of each possible reformulation before you spend R&D dollars
- Create precise sensory specification targets with evidence-based tolerances, not arbitrary ranges
Competitive Advantage You Can Actually Sustain
Understanding your position in the sensory landscape changes how you compete:
- Map the sensory territory your category currently occupies versus what consumers actually want
- Identify underserved sensory spaces where new products could dominate
- Quantify sensory differences to support credible marketing claims that drive preference
For instance, a household products manufacturer couldn’t understand why their “superior” products were being commoditized until the SIS application of quantitative data analytics to sensory testing revealed all competitors (including them) were clustered in the same crowded sensory space. By intentionally developing products with differentiated sensory profiles in an unoccupied sensory territory, they created a new premium tier with 42% higher margins and dramatically lower promotional spending.
Market Segmentation That Reflects Reality
Not all consumers want the same sensory experience, and pretending otherwise is costly:
- Identify distinct sensory preference segments in your category that traditional research misses
- Quantify the size and value of each segment to prioritize your opportunities
- Develop targeted products optimized for specific high-value segments instead of watered-down compromises
Integrating Sensory Analytics Into Your Development Process (For Real)

To extract maximum value from the SIS application of quantitative data analytics to sensory testing, you need to integrate these insights throughout your organization:
Early Stage Development: Stop Wasting Resources
Apply analytics to:
- Screen concepts based on sensory potential before wasting significant resources
- Identify the most promising sensory directions that align with consumer expectations
- Establish clear sensory targets for R&D based on actual consumer preference drivers, not assumptions
Mid-Development Optimization: Focus on What Actually Matters
Use analytics to:
- Quantify how prototype variations perform on key sensory dimensions that actually drive preference
- Identify which 2-3 sensory attributes to prioritize for further refinement instead of chasing marginal improvements
- Create mathematical models predicting consumer responses to formulation changes before expensive testing
Pre-Launch Validation: Know, Don’t Hope
Apply analytics to:
- Confirm your product meets sensory targets across key consumer segments, not just in aggregate
- Identify specific sensory advantages to emphasize in marketing that competitors can’t match
- Establish baseline measurements for ongoing quality monitoring that connects to consumer experience
Post-Launch Monitoring: Prevent Sensory Drift
Use analytics to:
- Track sensory consistency across production batches and manufacturing locations
- Identify early warning signs of sensory drift before it impacts sales and reputation
- Quantify the sensory impact of any ingredient or process changes before consumers notice
Organizations that build this complete analytical ecosystem through sensory research experts create a continuous improvement cycle that builds lasting competitive advantage—not just temporary wins.
The Technology Actually Enabling Next-Level Sensory Analytics

Several technologies are dramatically enhancing what you can extract from your sensory data:
AI and Machine Learning: Beyond Human Pattern Recognition
ال SIS application of quantitative data analytics to sensory testing now leverages advanced AI approaches that:
- Identify complex patterns in sensory data that traditional statistics (and human analysts) inevitably miss
- Predict consumer responses to new sensory combinations without expensive testing
- Create digital sensory models that accelerate product development by orders of magnitude
Integrated Sensory-Chemical Analysis: Connecting Experience to Formula
The SIS application of quantitative data analytics to sensory testing helps you:
- Identify exactly which chemical compounds drive specific sensory perceptions
- Create predictive models linking formulation changes to expected sensory outcomes
- Develop more precise sensory quality control specifications based on molecular markers
Cross-Modal Sensory Analysis: How Your Senses Trick Each Other
Modern SIS application of quantitative data analytics to sensory testing recognizes that senses interact in ways traditional testing misses, with techniques that:
- Map how visual appearance fundamentally alters taste perception (not just preference)
- Quantify how texture directly impacts fragrance experience at a neurological level
- Optimize multi-sensory integration for maximum impact on purchase intent
Case Study: How Analytics Transformed a Failing Product Line
Theory is fine, but you need results. Here’s how the SIS application of quantitative data analytics to sensory testing transformed a real business:
A premium coffee manufacturer watched helplessly as their market share declined quarter after quarter despite maintaining quality ingredients and manufacturing processes. Standard consumer testing showed generally positive responses but offered no explanation for the competitive losses.
Through comprehensive quantitative analytics applied to their sensory data, they discovered three shocking insights:
- Multivariate analysis revealed that 67% of consumer preference was explained by the specific sensory interaction between bitterness profile and aromatic complexity—not the overall intensity of either attribute they had been measuring
- Temporal analysis showed that while their coffee created excellent first impressions, it lacked the sensory “evolution” during consumption that drove satisfaction among key consumer segments
- Penalty analysis identified that their current roasting process created specific flavor notes that massively polarized consumers—34% found them highly appealing but 41% found them actively objectionable
Instead of continuing to make blind adjustments, they made targeted changes to their roasting profile and bean selection based on these specific insights. The transformation was immediate:
- Consumer preference scores jumped 26% among target demographics
- Competitive blind testing showed a 19% advantage over leading competitors
- Market share reversed its decline and grew 7% within six months
This wasn’t achieved through a complete reformulation or massive marketing spend—the SIS application of quantitative data analytics to sensory testing allowed them to make precise, targeted changes addressing the exact sensory drivers that were actually impacting consumer preference.
The ROI of Advanced Sensory Analytics: The Business Case That Actually Matters

Let’s cut the abstract benefits and talk numbers. The SIS application of quantitative data analytics to sensory testing typically delivers:
- 30-45% reduction in product optimization cycles
- 25-35% higher success rates for new product launches
- 15-25% reduction in development costs through elimination of unnecessary iterations
Here’s a concrete calculation you can take to your CFO: A personal care company investing $125,000 in advanced sensory analytics through the SIS application of quantitative data analytics to sensory testing identified optimization opportunities that increased purchase intent by 18%. For a product line with $12 million in projected annual sales, this represents $2.16 million in additional revenue—an ROI of over 1,700%.
As leading research experts note: “Advanced sensory analytics isn’t a cost center—it’s a profit driver that turns data into competitive advantage.”
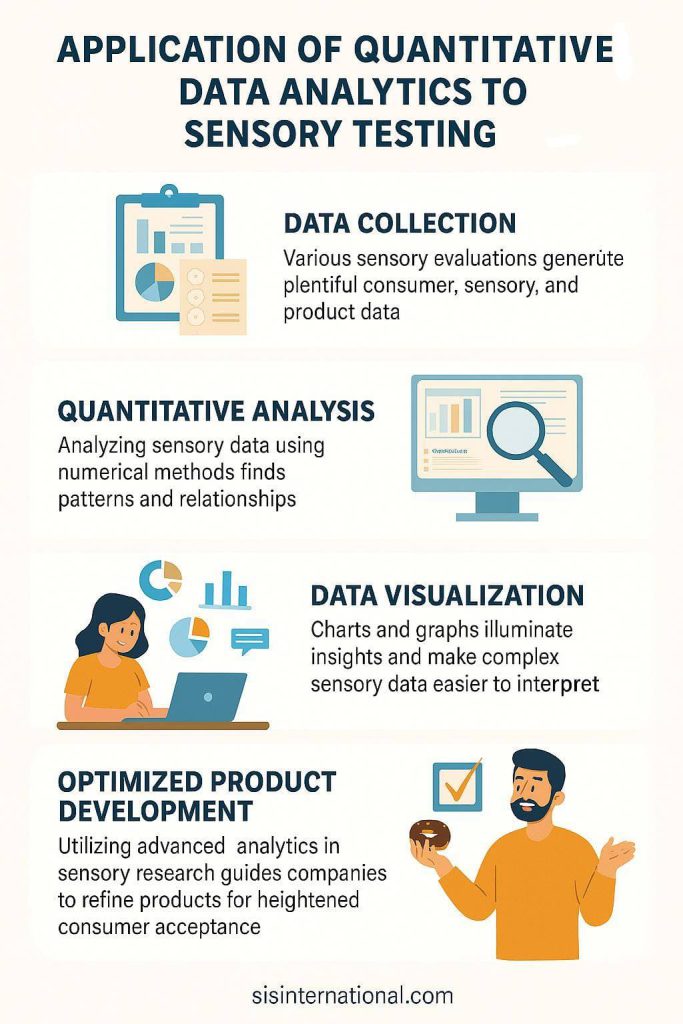
Key Insights Summary
✅ For the busy executives who actually make decisions (and those who skip to the end):
✅ Advanced analytics transforms subjective sensory experiences into objective data that drives precise product optimization targeting what actually matters
✅ Multivariate techniques reveal which combinations of sensory attributes actually influence consumer preference, often contradicting conventional wisdom
✅ Segmentation analysis identifies distinct consumer groups with different sensory preferences that get lost in aggregate data
✅ Temporal methods map how sensory perceptions evolve during product use, revealing critical moments most testing misses entirely
✅ Penalty analysis quantifies the exact preference impact when sensory attributes deviate from their ideal intensity
✅ Emerging technologies including AI, chemical analysis, and cross-modal techniques are widening the gap between leaders and followers
✅ Companies employing advanced sensory analytics achieve 29% higher returns on R&D investments—a competitive advantage that compounds over time
✅ The SIS approach combines specialized expertise, global coverage, and proprietary methodologies refined through four decades of sensory science
✅ Implementation throughout the development process creates a continuous improvement cycle that prevents sensory missteps
✅ The ROI for sophisticated sensory analytics typically exceeds 1,000% when measured against revenue impact
What Actually Makes SIS Quantitative Data Analytics Different
When you’re making million-dollar decisions based on sensory data, the quality of analytics isn’t just nice to have—it’s everything. The SIS application of quantitative data analytics to sensory testing creates value through several critical differentiators:
Ten Reasons Businesses Choose SIS for Quantitative Sensory Analytics:
- SPECIALIZED EXPERTISE: Unlike firms with generic statisticians, SIS employs data scientists who understand sensory data’s unique characteristics. We don’t just run standard analyses—we know which specific techniques answer your actual business questions.
- 40+ YEARS OF EXPERIENCE: With four decades immersed in sensory analytics, SIS has developed proprietary approaches refined through thousands of studies. This isn’t theoretical knowledge—it’s battle-tested expertise that prevents the methodological mistakes that lead to costly misinterpretations.
- GLOBAL DATA BASES FOR COMPARISON: Your sensory data doesn’t exist in a vacuum. SIS maintains extensive normative databases that instantly place your products in competitive context—showing how you perform and compare to category benchmarks across markets.
- MULTI-DISCIPLINARY INTEGRATION: The SIS application of quantitative data analytics to sensory testing doesn’t just connect numbers to numbers—it connects sensory science to statistics to consumer psychology to category expertise, creating interpretations that siloed teams simply cannot produce.
- OUTCOME-FOCUSED ANALYSIS: You don’t need a statistics lecture. SIS analytics relentlessly focus on answering your business questions with clear, actionable recommendations rather than drowning you in methodological details that don’t drive decisions.
- COST EFFECTIVE METHODOLOGY: SIS has developed streamlined analytical approaches that deliver comprehensive insights at 30-40% lower cost than traditional methods. This isn’t about cutting corners—it’s about efficient methodologies that extract maximum value from your research investment.
- CUSTOMIZED REPORTING: You receive analytics tailored to specific decision-makers, with visualization formats designed for R&D, marketing, and executive audiences. This isn’t just convenient—it ensures insights actually drive action throughout your organization.
- GLOBAL COVERAGE: With analytics teams across six continents, SIS integrates regional sensory data into unified global analyses while preserving crucial cultural context. For international brands, this prevents the sensory missteps that come from treating all markets as identical.
- SPEED OF ANALYSIS: Waiting months for insights isn’t just inconvenient—it’s competitive surrender. SIS’s proprietary analytical platforms deliver comprehensive sensory analytics 40% faster than industry averages, giving you answers when they can actually impact decisions.
- AGILITY AND ADAPTABILITY: While other firms cling to outdated methodologies, SIS analytical approaches evolve continuously to incorporate emerging techniques. This ensures you benefit from the latest advances in sensory data science without having to develop these specialized capabilities in-house.
FAQ: Real Answers to Your Questions About Quantitative Sensory Analytics
How does quantitative sensory analysis actually differ from standard consumer testing?
The difference is night and day. Standard consumer testing tells you who won the popularity contest without explaining why. Quantitative sensory analysis through the SIS application of quantitative data analytics to sensory testing reveals exactly which sensory attributes drive preference, how they interact with each other, and their relative importance in different usage contexts and consumer segments.
This transforms vague feedback like “consumers preferred Product A” into actionable insights like “consumers preferred Product A because its specific creamy texture neutralized the perceived bitterness, creating a balanced sensory experience that evolved positively over time.” The difference is between knowing what consumers like and understanding precisely why they like it—the knowledge that actually enables effective product optimization.
What sample sizes do you actually need for reliable quantitative sensory analysis?
The required sample depends on your objectives, but generally, quantitative consumer sensory tests need 100-300 participants for statistical reliability, while trained sensory panel evaluations may use 8-12 highly calibrated assessors.
The SIS application of quantitative data analytics to sensory testing includes power analysis to determine optimal sample sizes for your specific research questions, ensuring you get statistically valid results without wasteful over-sampling. Most importantly, sophisticated analytics can extract significantly more value from your existing sample sizes, often revealing critical insights in previously collected data that simpler analysis methods completely missed..
How do you actually translate complex analytics into things people will use?
This is where specialized expertise makes the difference between interesting statistics and business-changing insights. The SIS application of quantitative data analytics to sensory testing employs a four-step approach: identifying statistically significant patterns, evaluating their practical significance in your category, determining which factors you can actually influence through formulation or process changes, and creating specific recommendations tied to business objectives.
The deliverables include not just statistical outputs but clear, actionable recommendations in language relevant to each stakeholder group—whether R&D needs specific formulation targets, marketing needs substantiated claims, or executives need business impact projections.
Can sensory analytics actually predict market success?
Let’s be brutally honest: No analysis can guarantee market success. Anyone claiming otherwise is selling fantasy. However, the SIS application of quantitative data analytics to sensory testing dramatically improves predictive accuracy, typically achieving 75-85% correlation between predicted and actual market performance when sensory data is integrated with other key factors.
Is advanced sensory analytics only worth it for huge corporations?
This common misconception costs mid-sized companies millions in missed opportunities. While global corporations pioneered many techniques, the SIS application of quantitative data analytics to sensory testing offers scaled approaches making advanced analytics accessible to businesses of all sizes.
Most importantly, SIS offers modular approaches where you can apply advanced analytics to specific high-priority projects without requiring massive ongoing investment—making world-class sensory intelligence available regardless of your company size.
How does sensory analytics actually integrate with your other research?
The most powerful insights come from integration, not isolation. The SIS application of quantitative data analytics to sensory testing is specifically designed to connect with your other research streams, including concept testing, claims substantiation, packaging research, and market analysis.
Advanced techniques can link sensory attributes directly to concept promises, verify which sensory experiences support specific claims, quantify how packaging creates sensory expectations, and identify the sensory factors that most differentiate your brand positioning. This integration creates a unified understanding of your product experience rather than disconnected research silos, ensuring all aspects of product development work toward consistent consumer satisfaction.
موقع منشأتنا في نيويورك
11 إي شارع 22، الطابق 2، نيويورك، نيويورك 10010 هاتف: 1(212) 505-6805+
حول سيس الدولية
سيس الدولية يقدم البحوث الكمية والنوعية والاستراتيجية. نحن نقدم البيانات والأدوات والاستراتيجيات والتقارير والرؤى لاتخاذ القرار. نقوم أيضًا بإجراء المقابلات والدراسات الاستقصائية ومجموعات التركيز وغيرها من أساليب وأساليب أبحاث السوق. اتصل بنا لمشروع أبحاث السوق القادم.

