What is Cluster Analysis?

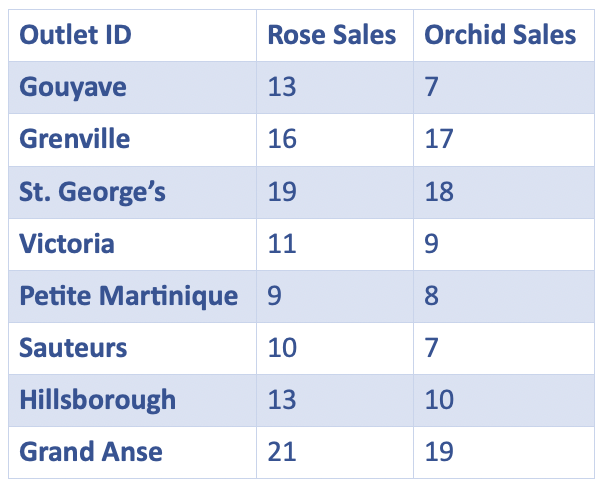
Cluster Analysis is a technique that explores the natural groups within a data set. For example, a simple use case is to group retail outlets based on their sales. Assume that a plant shop has eight outlets in the city. The table below shows the sales of rose plants and orchids per day.

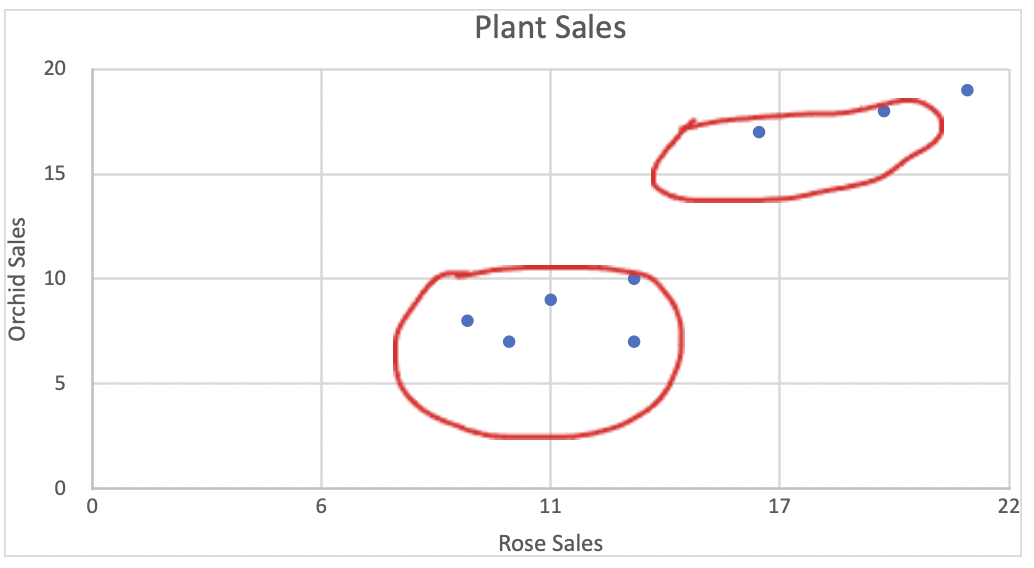
The graph below shows the same data where we plot each outlet’s rose plant and orchid sales on the X and Y axes.

This example has limited data points. Thus it was easy to plot the two clusters of plant shop outlets on the graph and see the visuals. When it comes to thousands of data points, you’ll need to use Cluster Analysis algorithms. They will further segregate the data points into different clusters.
Why is Cluster Analysis Important?
With clustering, researchers can identify and define patterns between data elements. Furthermore, revealing these patterns between data points helps to distinguish and outline structures. These structures might not have been evident before. Yet they are notable to the data once discovered. Informed decision-making becomes much easier once a defined structure emerges.
Key Job Title – Data Scientist
Data scientists must know stats, math, business analysis, modeling, and tech. Moreover, they must transform high volumes of complex data into advanced analytic solutions. These scientists develop, maintain, and collect structured and unstructured data sets. They use these sets to analyze, report, and create projections, models, reports, and displays. These support the company’s business tactics and strategy.
Why Businesses Need Cluster Analysis
Cluster Analysis helps companies to determine customer response to their products and services. It arranges the customers with the same attributes in one cluster. Thus, it allows firms to organize their services. They can also offer specific products to different groups. It is helpful for companies to understand consumer behavior. They learn things like customers’ tastes. They can also see their response to products and services and buying patterns.
Key Success Factors
A suitable method will produce high-quality clusters. Thus, your findings should be similar for a single group. The opposite should happen when there is more than one cluster. The quality of the sets depends on the method and how you execute it. Your approach should also discover some or all hidden patterns that may exist within the data. The most common measure for clusters is the Euclidean distance. It shows how far one group’s center is from the center of another set.
About Cluster Analysis Market Research
Qualitative Market Research adds depth. But it can produce large amounts of complex data even with small samples. You can apply Cluster Analysis to coded Qualitative data to clarify findings. It will aid in your efforts to reveal such things as the participants’ motives for their actions. It will also show you the reasons behind the findings that, on the cover, make no sense. Studies conducted with different samples often produce tons of Qualitative data. But they may need more sample sizes for advanced Quantitative Market Research.
UX Market Research is also crucial. You can gain insights with User Interviews, Market Entry Research, Analytics, and Surveys. Combining these tactics should provide a solid overview of your user base.
Cluster Analysis is also great for Market Opportunity Research. You can find competitive sets in your market by clustering products and brands. Brands within a cluster compete more with one another than brands in another group. As a company, you can examine your current offerings and compare them to those of rival firms. That way, they can see what’s possible with new product opportunities.
Cluster Analysis is functional. Many market researchers use it for market positioning and segmentation. They also use it to find test markets for new products. Various software programs exist to assist with the analysis part. But it’s best to partner with a skilled market researcher who can design the study to collect the relevant data. That way, you can be sure your data comes from adequate and representative sample sizes.


